Visual Symbols
- are representations of direct reality, which comes in the form of signs and symbols.

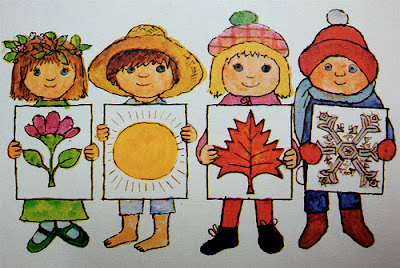
Drawings
- a drawing may not be real thing but better to have a concrete visual aid than nothing. To avoid confusion, it is good that our drawing correctly represents the real thing.

Cartoons
- another useful visual symbol that can bring novelty to our teaching is the cartoon. A first-rate cartoon tells its story metaphorically.
 |
Strip Drawings
- a sequence of drawings in a newspaper, magazine, etc., relating a humorous story or an adventure.

Diagrams
- “It is any line drawing that shows arrangement and relations as of parts to the whole, relative values, origins and development, chronological fluctuations, distributions, etc.” (Dale 1969)

Types of Diagrams
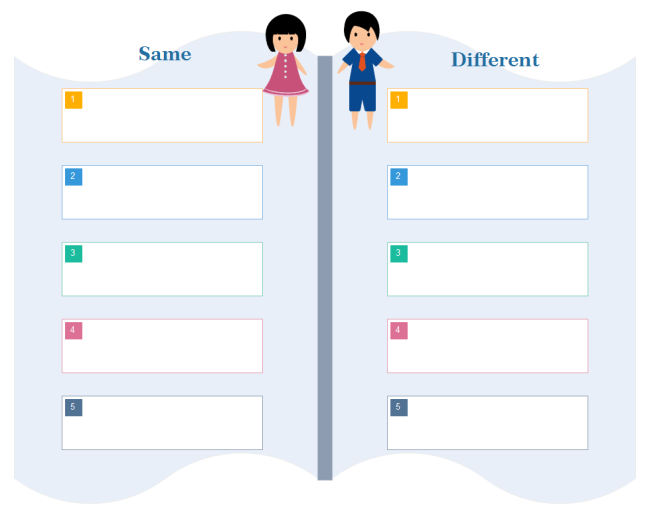
- Affinity Diagram – used to cluster complex apparently unrelated data into natural and meaningful groups.

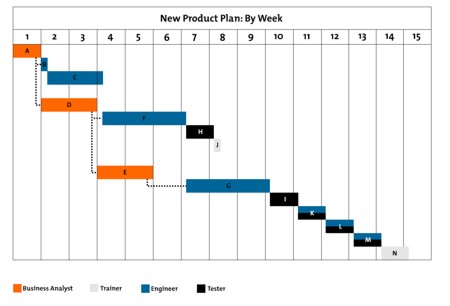
- Tree Diagram – used in increasing details or various tasks that must be accomplished to complete a project.

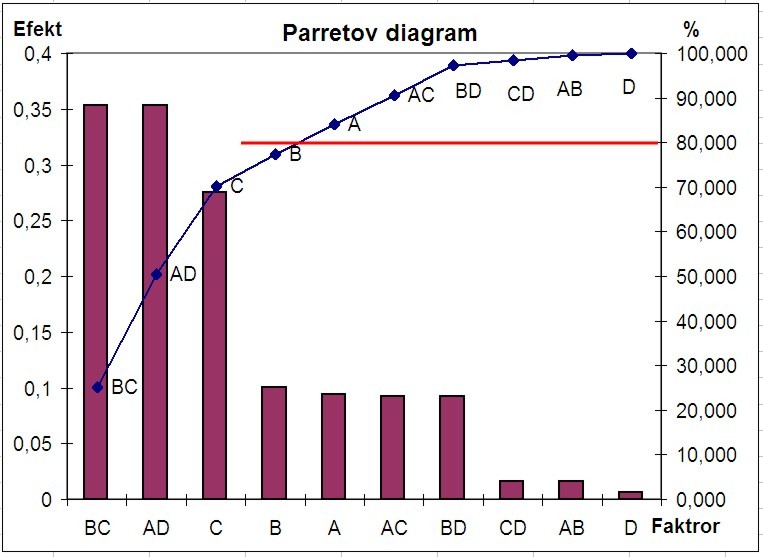
- Fishbone Diagram – cause-and-effect diagram.

Charts it is
a diagrammatic representation of relationships among individuals within anorganizations.

Types of Charts


Flow
Chart visual way of showing a process from beginning to end.


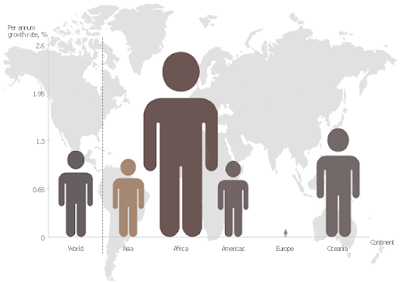
Graphs
- Pictures that help us understand data.

Types of Graphs
Circle
Graph recommended for showing parts of whole.


Maps
- Is a representation of the surface of the earth or some part of it.

Types of Maps
- Physical Map altitude, temperature, rainfall, precipitation, vegetation and soil.

- Relief Map three dimensional represents and show contours of the physical data of the earth or part of the earth.

- Political Map gives detailed information about country, provinces, lakes, rivers etc.

- Poster is a large print, ad or decoration that can be displayed or hung in the wall.

Walang komento:
Mag-post ng isang Komento